[ad_1]

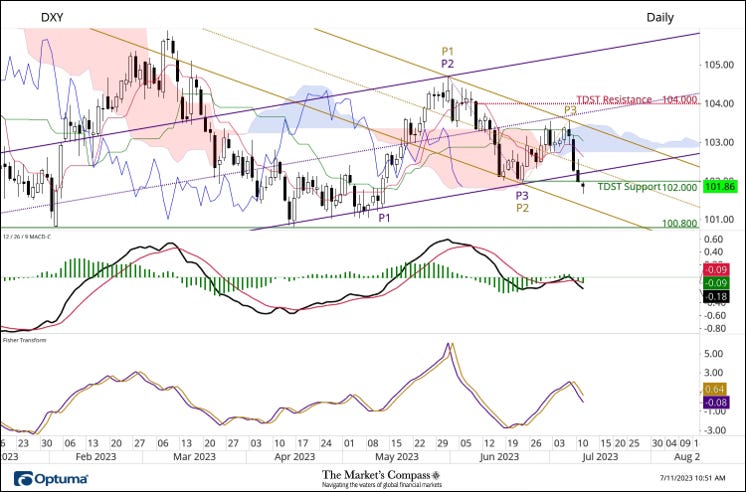
On Tuesday morning I Tweeted a chart and my thoughts on the technical condition of the DXY. That Daily Chart and my comments are posted below. “Last Friday the DXY impulsively fell back below the Cloud and the Median Line (gold dotted line) of the shorter-term bearish Schiff Modified Pitchfork (gold P1 through P3). On Monday prices fell and closed below the lower Parallel (solid purple line) of the longer-term bullish Schiff Modified Pitchfork (purple P1 through P3) and today, prices violated TDST Support at the 102 level. MACD has rolled over through its signal line after failing to retake the ground in positive and the Fisher Transform is also tracking lower under its signal line. The weight of the negative evidence and the violations of several support levels have greatly increased the odds that key support at 101.80 will be tested. Only if support at the Lower Parallel of the gold Schiff Modified Pitchfork holds continued selling pressure will have me re-think my technical thesis.”As can be seen from the updated chart posted below, after a brief pause the selloff reignited to the down side and the index broke the two levels of support mentioned in my comments from Tuesday. During Wednesday’s trading session the index quickly violated potential support at the Lower Parallel (solid gold line) of the Schiff Modified Pitchfork (gold P1 through P3) and later in the session the DXY plowed through potential price support at the 100.80 level which had held price pullbacks in early February and April. As the saying goes “ jump up and down on a trap door enough times, it will splinter and give way”. The selloff has continued this AM and the index is moving farther away from broken price support which now, following the rule of polarity, should serve as as resistance (100.80) in any over sold bounce which will inevitably unfold but there is little evidence that sell off has reached it’s nadir. Both MACD and the Fisher Transform certainly do not suggest that the current leg lower has run its course.We are currently watching the 4-Hour chart closely for any hint that an oversold bounce could be developing but as can be seen in the chart below (using the same ancillary technical indicators that I used on the Daily Chart above) there is nary a hint at a turn despite the oversold condition. The longer-term Weekly Chart below does not add any comfort to anyone lugging long positions in the “green back”. After breaking Weekly Cloud support early this year the DXY failed to retake the ground inside the Cloud and was capped since early June by the Upper Warning Line (purple dashed line UWL) of the Schiff Modified Pitchfork (P1 through P3) and the Kijun Plot (green line) since the middle of last month. MACD is rolling over through it signal line again as it tracks in negative territory and the Fisher Transform is back below its signal line. The only technical feature that might help slow the drop is potential support at the Upper Parallel (solid purple line) of the Schiff Modified Pitchfork.In conclusion this still a live technical grenade and it would be folly to through one’s self on top of it. Not yet, until it at the very least it is defused.For readers who are unfamiliar with the technical terms or tools referred to in the comments on the short-term technical condition of the DXY can avail themselves of a brief tutorial titled, Tools of Technical Analysis or the Three-Part Pitchfork Papers that is posted on The Markets Compass website…https://themarketscompass.comCharts are courtesy of Optuma.To receive a 30-day trial of Optuma charting software go to…www.optuma.com/TMC
[ad_2]
Sign in
Welcome! Log into your account
Forgot your password? Get help
Privacy Policy
Password recovery
Recover your password
A password will be e-mailed to you.

